


Could Strategy’s Bitcoin Sale Lead to an S&P Credit Upgrade?
Could Strategy’s Bitcoin Sale Lead to an S&P Credit Upgrade? Binance Launches Spot Trading for Michael Saylor’s STRC Preferred Stock Michael Saylor’s Strategy Sells 3,588 Bitcoin for $216 Million SpaceX Joins Nasdaq-100 Tomorrow, Becoming Index's Third Bitcoin Holder Strive Tells Investors Not to Assume Automatic SATA Issuance at $100
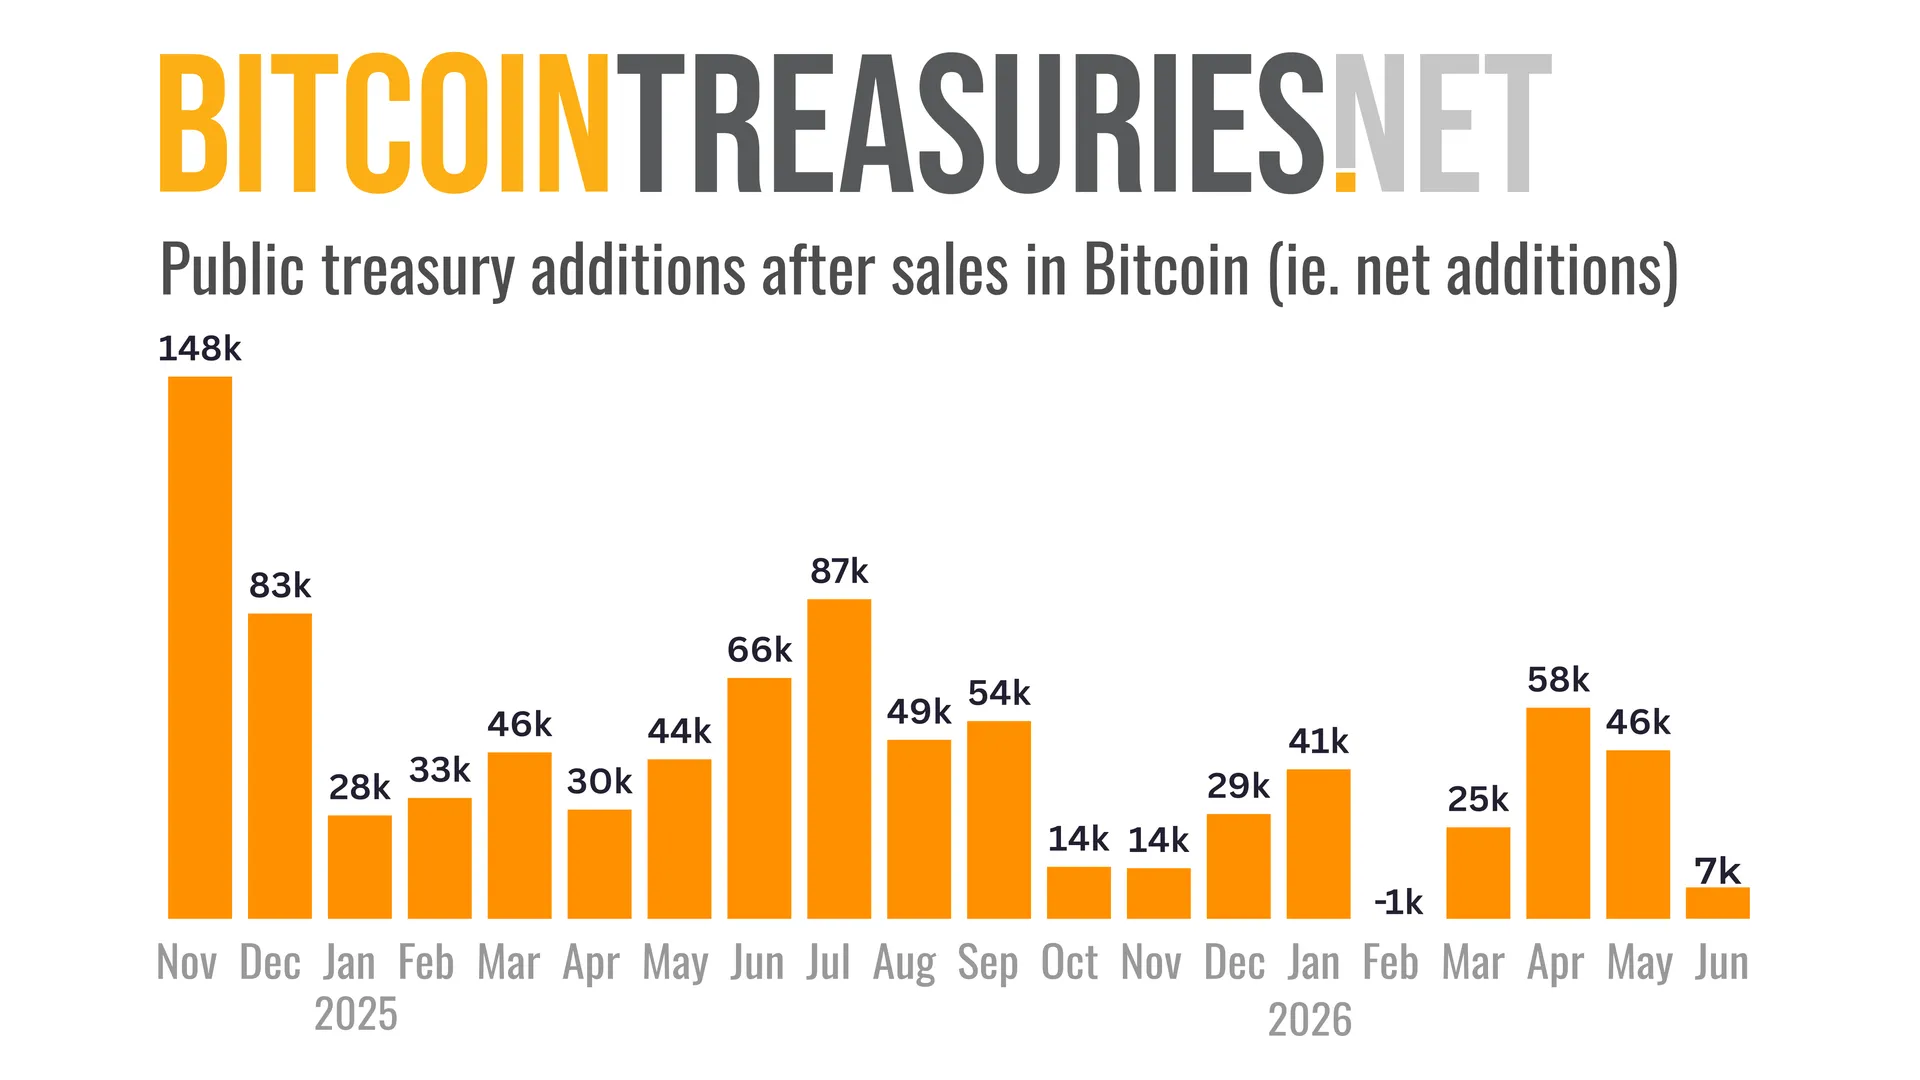
Could Strategy’s Bitcoin Sale Lead to an S&P Credit Upgrade? Binance Launches Spot Trading for Michael Saylor’s STRC Preferred Stock Michael Saylor’s Strategy Sells 3,588 Bitcoin for $216 Million SpaceX Joins Nasdaq-100 Tomorrow, Becoming Index's Third Bitcoin Holder Strive Tells Investors Not to Assume Automatic SATA Issuance at $100 Bitcoin treasuries added 9K BTC in June; Strategy and Strive dominated growth
Could The US Government Fork Bitcoin Out From Under Saylor & MSTR? (OG Explains)
Saylor owns almost 5% of Bitcoin's supply. Strategy could cross one million coins. Could the US government fork Bitcoin out from under MSTR? Brandon Quittem — author of The Mycelium of Money and one of Bitcoin's most widely read thinkers — says the answer isn't what you think.
Bitcoin ETFs, Exchanges, and Other Custodians
Bitcoin ETFs, funds, and exchanges ranked by total BTC under management.
BTC Held by ETFs and Exchanges
1.623M
$100.70B
Number of ETFs and Exchanges
49
BTC Price
$62,065
Asset Dominance
94.7%
BTC 94.7% ETH 4.6% SOL .46% BNB .13% XRP .15%
ETFs and Exchanges Ranked by Bitcoin Holdings
| # | Name | ||||
|---|---|---|---|---|---|
| 1 | 🇺🇸 | ₿ 811,291 | $50,353M | 3.863% | |
| 2 | 🇺🇸 | ₿ 185,798 | $11,532M | 0.885% | |
| 3 | 🇺🇸 | ₿ 150,744 | $9,356M | 0.718% | |
| 4 | 🇺🇸 | ₿ 53,002 | $3,290M | 0.252% | |
| 5 | 🇬🇮 | ₿ 38,931 | $2,416M | 0.185% | |
| 6 | 🇺🇸 | ₿ 38,501 | $2,390M | 0.183% | |
| 7 | 🇺🇸 | ₿ 37,645 | $2,336M | 0.179% | |
| 8 | 🇯🇵 | ₿ 34,504 | $2,142M | 0.164% | |
| 9 | 🇺🇸 | ₿ 25,355 | $1,574M | 0.121% | |
| 10 | 🇯🇪 | ₿ 20,297 | $1,260M | 0.097% | |
| 11 | 🇸🇪 | ₿ 20,085 | $1,247M | 0.096% | |
| 12 | 🇨🇦 | ₿ 19,170 | $1,190M | 0.091% | |
| 13 | 🇬🇧 | ₿ 17,449 | $1,083M | 0.083% | |
| 14 | 🇺🇸 | ₿ 16,948 | $1,052M | 0.081% | |
| 15 | 🇸🇨 | ₿ 15,432 | $958M | 0.073% | |
| 16 | 🇨🇭 | ₿ 13,926 | $864M | 0.066% | |
| 17 | 🇨🇦 | ₿ 13,401 | $832M | 0.064% | |
| 18 | 🇩🇪 | ₿ 11,266 | $699M | 0.054% | |
| 19 | 🇺🇸 | ₿ 8,530 | $529M | 0.041% | |
| 20 | 🇨🇭 | ₿ 8,195 | $509M | 0.039% | |
| 21 | 🇱🇮 | ₿ 8,195 | $509M | 0.039% | |
| 22 | 🇨🇦 | ₿ 8,016 | $498M | 0.038% | |
| 23 | 🇺🇸 | ₿ 6,760 | $420M | 0.032% | |
| 24 | 🇺🇸 | ₿ 6,410 | $398M | 0.031% | |
| 25 | 🇺🇸 | ₿ 6,331 | $393M | 0.030% | |
| 26 | 🇧🇷 | ₿ 5,440 | $338M | 0.026% | |
| 27 | 🇯🇪 | ₿ 4,402 | $273M | 0.021% | |
| 28 | 🇨🇦 | ₿ 4,336 | $269M | 0.021% | |
| 29 | 🇺🇸 | ₿ 4,188 | $260M | 0.020% | |
| 30 | 🇺🇸 | ₿ 3,746 | $232M | 0.018% | |
| 31 | 🇨🇦 | ₿ 2,868 | $178M | 0.014% | |
| 32 | 🇺🇸 | ₿ 2,620 | $163M | 0.012% | |
| 33 | 🇭🇰 | ₿ 2,603 | $162M | 0.012% | |
| 34 | 🇨🇦 | ₿ 2,558 | $159M | 0.012% | |
| 35 | 🇨🇦 | ₿ 2,339 | $145M | 0.011% | |
| 36 | 🇧🇷 | ₿ 1,545 | $96M | 0.007% | |
| 37 | 🇩🇪 | ₿ 1,480 | $92M | 0.007% | |
| 38 | 🇦🇺 | ₿ 1,447 | $90M | 0.007% | |
| 39 | 🇧🇷 | ₿ 1,386 | $86M | 0.007% | |
| 40 | 🇦🇺 | ₿ 1,304 | $81M | 0.006% | |
| 41 | 🇭🇰 | ₿ 1,224 | $76M | 0.006% | |
| 42 | 🇭🇰 | ₿ 995 | $62M | 0.005% | |
| 43 | 🇺🇸 | ₿ 946 | $59M | 0.005% | |
| 44 | 🇨🇭 | ₿ 269 | $17M | 0.001% | |
| 45 | 🇩🇪 | ₿ 214 | $13M | 0.001% | |
| 46 | 🇱🇮 | ₿ 197 | $12M | 0.001% | |
| 47 | 🇺🇸 | ₿ 135 | $8M | 0.001% | |
| 48 | 🇺🇸 | ₿ 110 | $7M | 0.001% | |
| 49 | 🇬🇧 | ₿ 2 | $0M | 0.000% | |
| 50 | 🇬🇧 | ₿ 0 | $0M | 0.000% | |
Total: | 1,622,533 | $100,703M | 7.726% | ||
