


Bitcoin Treasuries Conference Returns to NYC on September 28, Where Last Year's Room Started a $1.4 Billion Deal
Bitcoin Treasuries Conference Returns to NYC on September 28, Where Last Year's Room Started a $1.4 Billion Deal Strategy Raises STRC Dividend to 12%, And Launches $2B Buyback Programs The Dangerous Temptation of Defending STRC with Cash How We're Updating mNAV on BitcoinTreasuries.net How STRC fell under $80 - And What Strategy Must Do Now
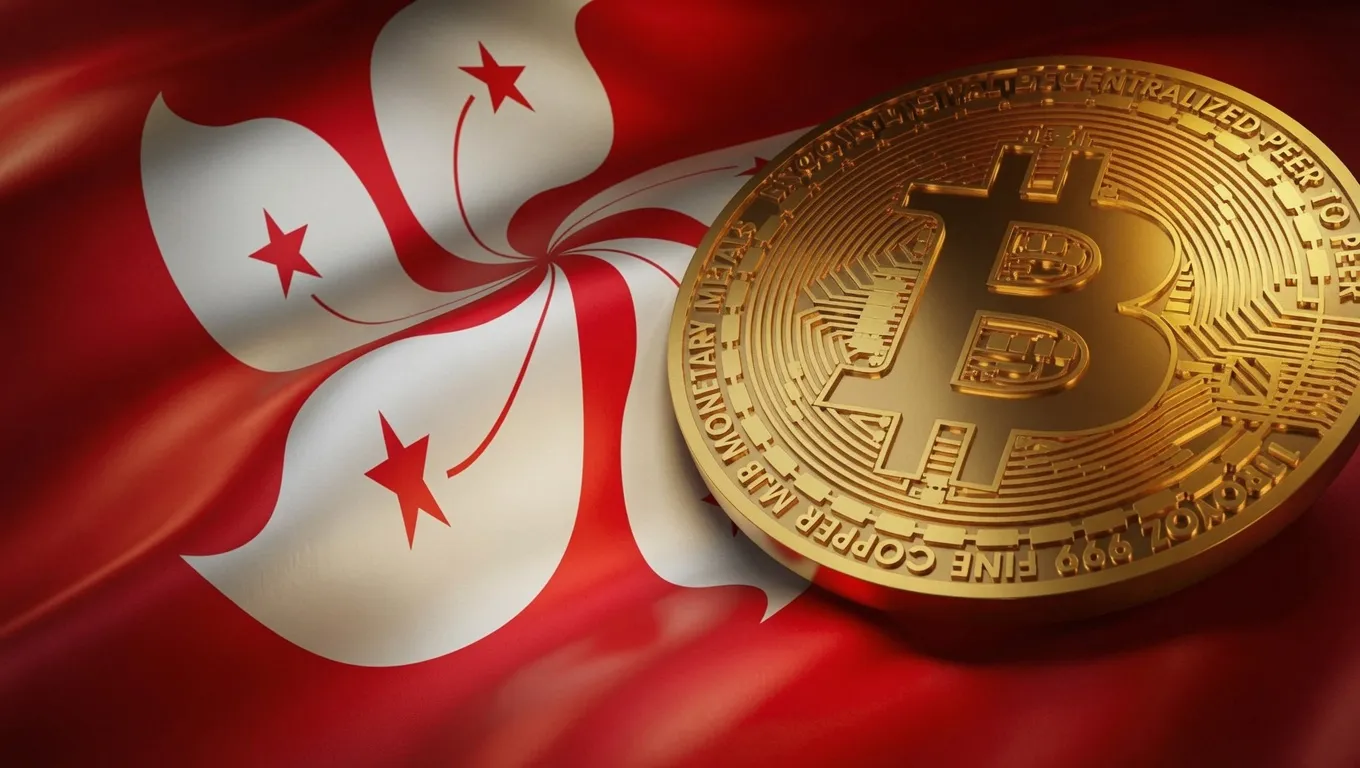
Bitcoin Treasuries Conference Returns to NYC on September 28, Where Last Year's Room Started a $1.4 Billion Deal Strategy Raises STRC Dividend to 12%, And Launches $2B Buyback Programs The Dangerous Temptation of Defending STRC with Cash How We're Updating mNAV on BitcoinTreasuries.net How STRC fell under $80 - And What Strategy Must Do Now Hong Kong-Based CIMG Inc. Raises $13.5M, Paid Entirely in Bitcoin
Could The US Government Fork Bitcoin Out From Under Saylor & MSTR? (OG Explains)
Saylor owns almost 5% of Bitcoin's supply. Strategy could cross one million coins. Could the US government fork Bitcoin out from under MSTR? Brandon Quittem — author of The Mycelium of Money and one of Bitcoin's most widely read thinkers — says the answer isn't what you think.
Government Bitcoin Holdings
Monitor government Bitcoin holdings globally. Track BTC reserves held by countries, states, and government agencies with detailed acquisition data.
BTC Held by Government Entities
649,947
$38.00B
Number of Government Entities
13
BTC Price
$58,471
Asset Dominance
94.8%
BTC 94.8% ETH 4.4% SOL .48% BNB .13% XRP .16%
Governments and Countries Ranked by Bitcoin Holdings
| # | Name | ||||
|---|---|---|---|---|---|
| 1 | 🇺🇸 | ₿ 328,372 | $19,200M | 1.564% | |
| 2 | 🇨🇳 | ₿ 190,000 | $11,109M | 0.905% | |
| 3 | 🇬🇧 | ₿ 61,245 | $3,581M | 0.292% | |
| 4 | 🇺🇦 | ₿ 46,351 | $2,710M | 0.221% | |
| 5 | 🇸🇻 | ₿ 7,699 | $450M | 0.037% | |
| 6 | 🇦🇪 | ₿ 6,420 | $375M | 0.031% | |
| 7 | 🇧🇹 | ₿ 4,973 | $291M | 0.024% | |
| 8 | 🇰🇿 | ₿ 3,544 | $207M | 0.017% | |
| 9 | 🇰🇵 | ₿ 803 | $47M | 0.004% | |
| 10 | 🇻🇪 | ₿ 240 | $14M | 0.001% | |
| 11 | 🇹🇼 | ₿ 210 | $12M | 0.001% | |
| 12 | 🇫🇮 | ₿ 90 | $5M | 0.000% | |
| 13 | 🇺🇸 | ₿ 0 | $0M | 0.000% | |
| 14 | 🇧🇬 | ₿ 0 | $0M | 0.000% | |
| 15 | 🇩🇪 | ₿ 0 | $0M | 0.000% | |
Total: | 649,947 | $38,003M | 3.095% | ||
