


BPS or CEBE? The Debate Dividing Bitcoin Treasury Leaders
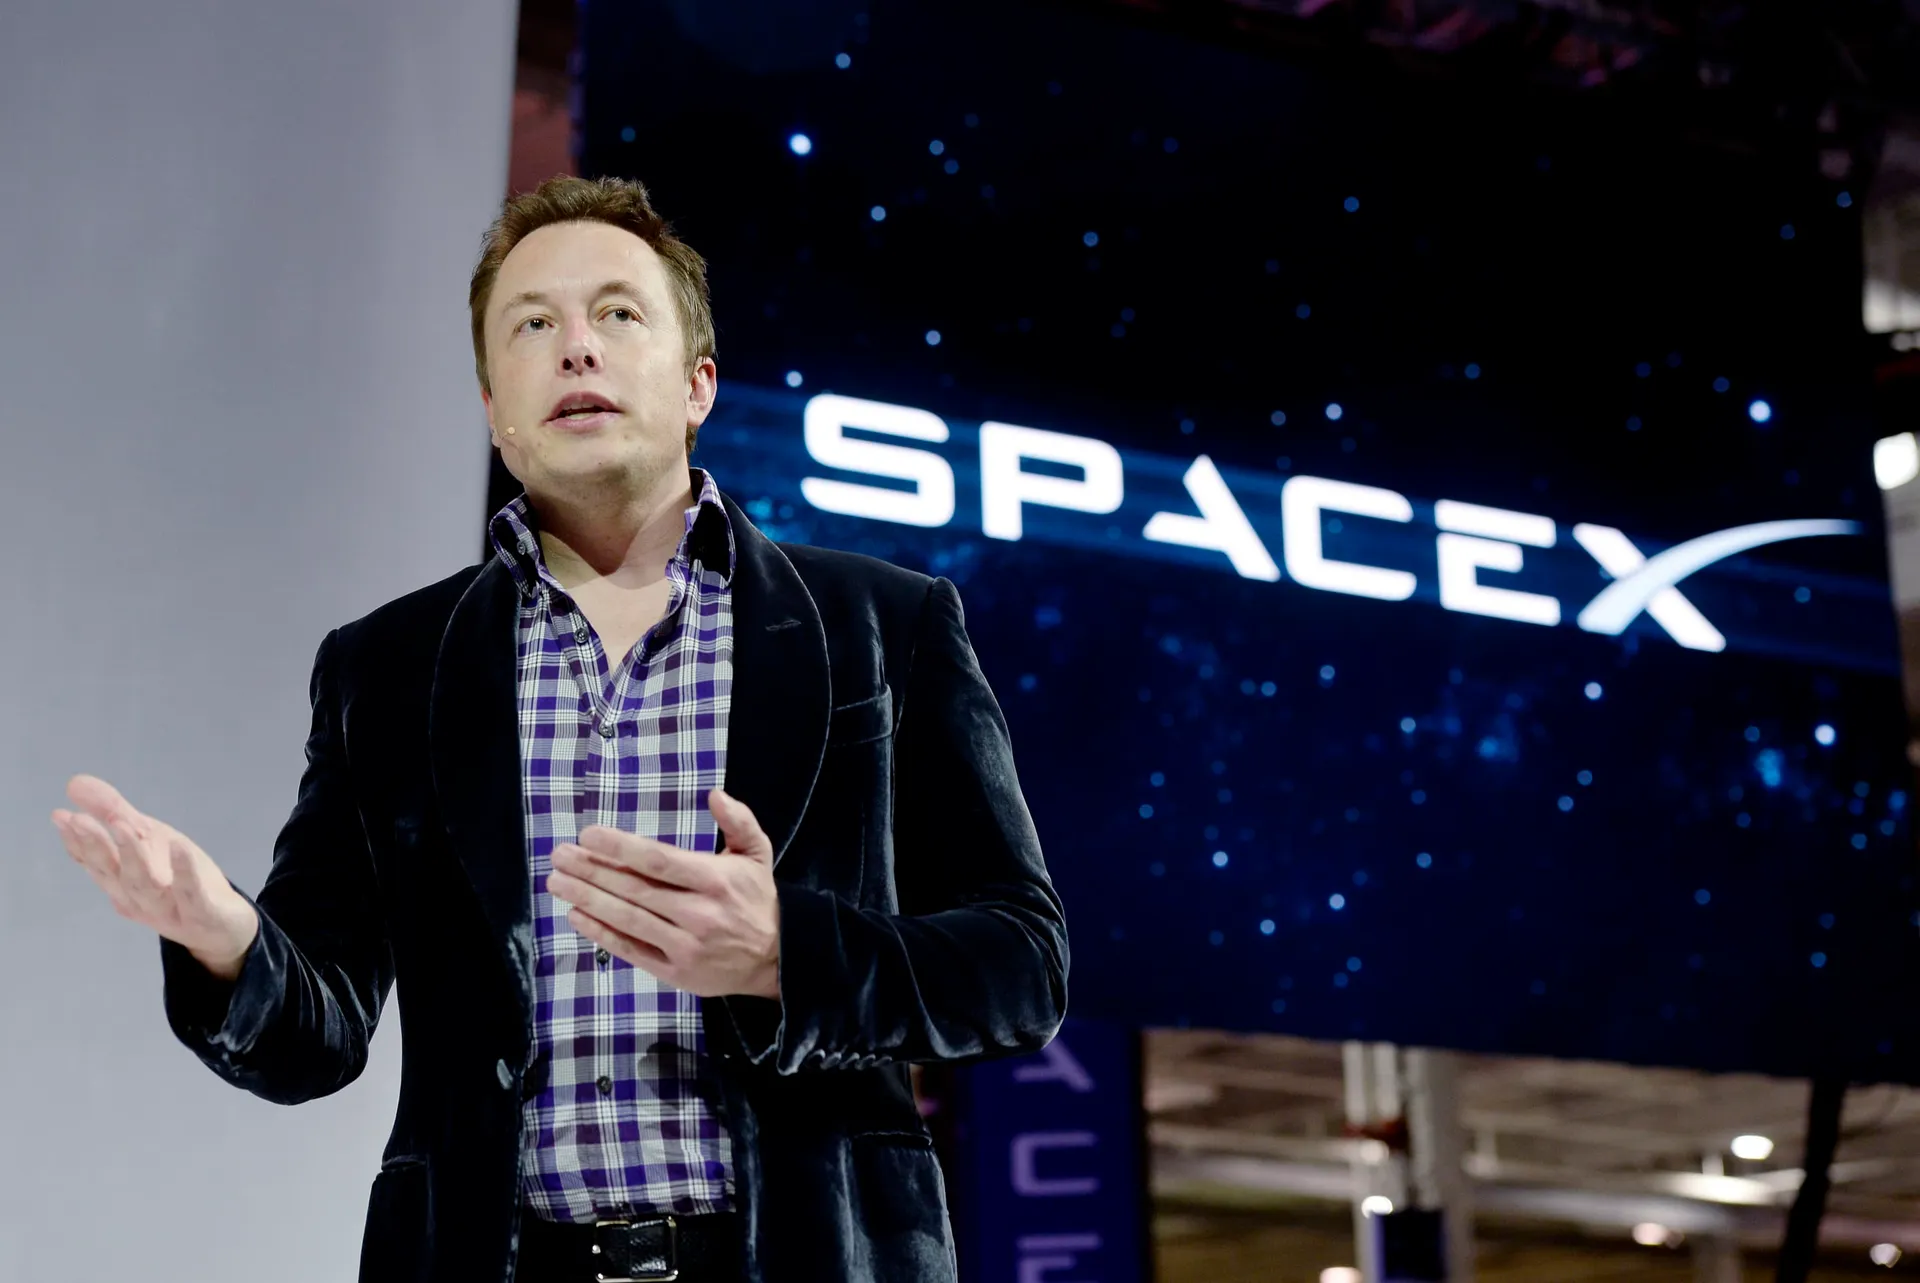
BPS or CEBE? The Debate Dividing Bitcoin Treasury Leaders Elon Musks SpaceX Officially Becomes 8th Largest Public Bitcoin Holder with 18,712 BTC DATA DROP: Strive Is Now Accumulating Bitcoin Faster Than Any Company Bitmine Accumulates 125,000 ETH Worth $205M According to On-Chain Data Why Metaplanet Should Buy Nakamoto to Issue US Bitcoin Preferred Stock
BPS or CEBE? The Debate Dividing Bitcoin Treasury Leaders Elon Musks SpaceX Officially Becomes 8th Largest Public Bitcoin Holder with 18,712 BTC DATA DROP: Strive Is Now Accumulating Bitcoin Faster Than Any Company Bitmine Accumulates 125,000 ETH Worth $205M According to On-Chain Data Why Metaplanet Should Buy Nakamoto to Issue US Bitcoin Preferred Stock Inside Falconedge: How One UK Treasury Firm Earns Yield in a Downturn
Replay: Bitcoin Treasuries Unconference UK
Watch the Bitcoin Treasuries Unconference UK 2026 replay. Featuring Phong Le (Strategy), Matt Cole (Strive), Kwasi Kwarteng, Alexandre Laizet & Lance Vitanza (TD Cowen) with 25+ speakers.
DeFi and Similar Entities
DeFi protocols and other on-chain entities holding Bitcoin.
BTC Held by DeFi and Other
379,106
$24.85B
Number of DeFi and Other
16
BTC Price
$65,554
Asset Dominance
95.0%
BTC 95.0% ETH 4.3% SOL .41% BNB .13% XRP .16%
DeFi Protocols Ranked by Bitcoin Holdings
| # | Name | ||||
|---|---|---|---|---|---|
| 1 | ₿ 125,330 | $8,216M | 0.597% | ||
| 2 | ₿ 87,668 | $5,747M | 0.417% | ||
| 3 | ₿ 65,301 | $4,281M | 0.311% | ||
| 4 | ₿ 34,808 | $2,282M | 0.166% | ||
| 5 | ₿ 11,780 | $772M | 0.056% | ||
| 6 | ₿ 10,930 | $717M | 0.052% | ||
| 7 | ₿ 8,643 | $567M | 0.041% | ||
| 8 | 🇻🇬 | ₿ 6,997 | $459M | 0.033% | |
| 9 | ₿ 5,941 | $389M | 0.028% | ||
| 10 | ₿ 4,861 | $319M | 0.023% | ||
| 11 | 🇺🇸 | ₿ 4,370 | $286M | 0.021% | |
| 12 | ₿ 4,283 | $281M | 0.020% | ||
| 13 | ₿ 4,156 | $272M | 0.020% | ||
| 14 | ₿ 2,696 | $177M | 0.013% | ||
| 15 | ₿ 829 | $54M | 0.004% | ||
| 16 | ₿ 513 | $34M | 0.002% | ||
| 17 | 🇺🇸 | ₿ 0 | $0M | 0.000% | |
Total: | 379,106 | $24,852M | 1.805% | ||
